This photograph is temporarily unavailable.
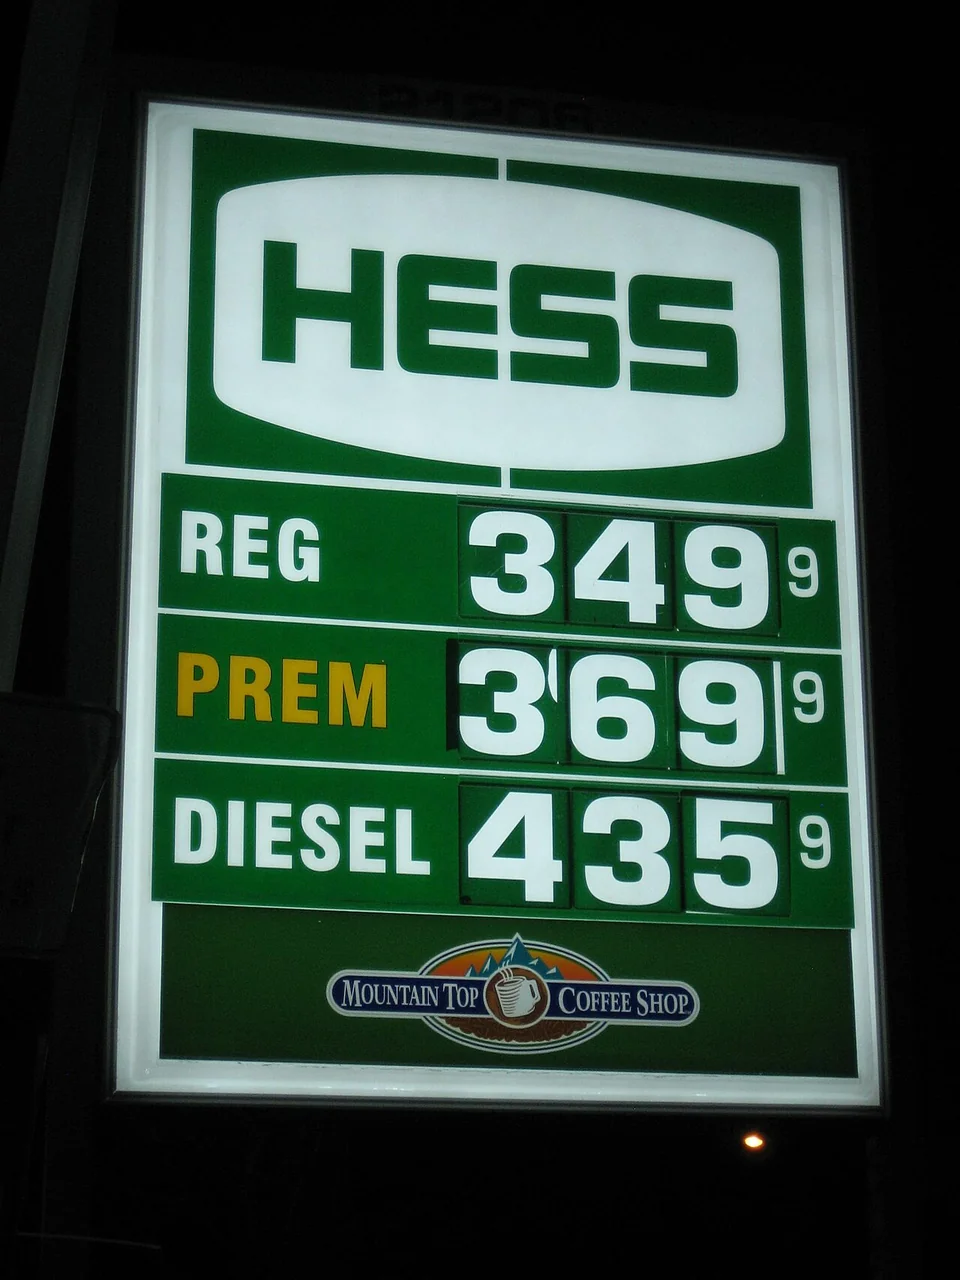
April 30, 2008: $3.499 per gallon at Wilmington, Massachusetts. Regular. Browse historical gasoline price photos and compare U.S. averages.
Price read directly from the photograph. Capture date, place, creator, and rights checked in source file metadata. Photograph source · CC BY 2.0
What did gas cost? Browse dated station photos, or choose U.S. average to explore the national price.
Prices are per U.S. gallon. A small raised digit means tenths of a cent: $4.89⁹ is $4.899. A raised ½ means half a cent. The first two numbers show the photographed price and the U.S. average from that time. The third converts one of those prices into current dollars; tap it to switch between the photo and the average. The chart has its own dollar switch. A converted price is not today’s selling price.
Inflation comparisons use the U.S. CPI-U, all items, not seasonally adjusted. A month uses that month’s index; a year-only photo uses the year’s average. The month in “In Current” is the latest published CPI month and updates as new data arrives. CPI compares general purchasing power, not wages or driving costs.
Older prices are annual averages. From August 1990 onward, prices are weekly. The year in the U.S. average heading identifies the historical price; the month in “In Current” identifies the conversion date.
For a weekly average, we look within 45 days for the closest eligible regular-gas price. For an annual average, we look within that year. If there is no suitable photo, the photo space stays empty.
The photo keeps its own date and price. Stores and stations can charge more or less than the national average.
The small i on each photo shows who took it, where it came from and its license. Some photos allow noncommercial use only; those are marked there.
Some dates and places are approximate. “c.” means “circa,” or “around.” A map pin may show a town or a wider area. Check the photo’s i for how much we know.
A selected day uses the nearest weekly price within 10 days, or that year’s annual average. Early figures are rounded to cents. Annual prices cover regular leaded gas through 1990, then regular unleaded. Weekly prices include taxes. Premium and specialty grades, uncertain years, and unclear station operating status are excluded from automatic matching. Cash and credit terms can still differ.
When only a month or year is known, we place the photo halfway through it. A decade-only photo sits in the middle of the decade and shows the mean of its annual averages. It isn’t used for price matching.
The map uses public-domain Natural Earth data.
200 photographs. Average data downloaded 2026-09-19.
Gasoline · Milk · Eggs
1921 · 1925 · 1932 · 1935 · 1936 · 1938 · 1939 · 1940 · 1942 · 1949 · 1951 · 1954 · 1957 · 1958 · 1959 · 1963 · 1965 · 1966 · 1968 · 1971 · 1972 · 1974 · 1975 · 1976 · 1979 · 1981 · 1982 · 1984 · 1985 · 1986 · 1987 · 1989 · 1990 · 1991 · 1992 · 1993 · 1994 · 1995 · 1996 · 1998 · 1999 · 2000 · 2001 · 2004 · 2005 · 2006 · 2007 · 2008 · 2009 · 2010 · 2011 · 2012 · 2013 · 2014 · 2015 · 2016 · 2017 · 2018 · 2019 · 2021 · 2022 · 2023 · 2024 · 2025 · 2026
Download photo records · Download average data
Price read directly from the photograph. Capture date, place, creator, and rights checked in source file metadata. Individual station price at the photographed moment; not a national or local average.