This photograph is temporarily unavailable.
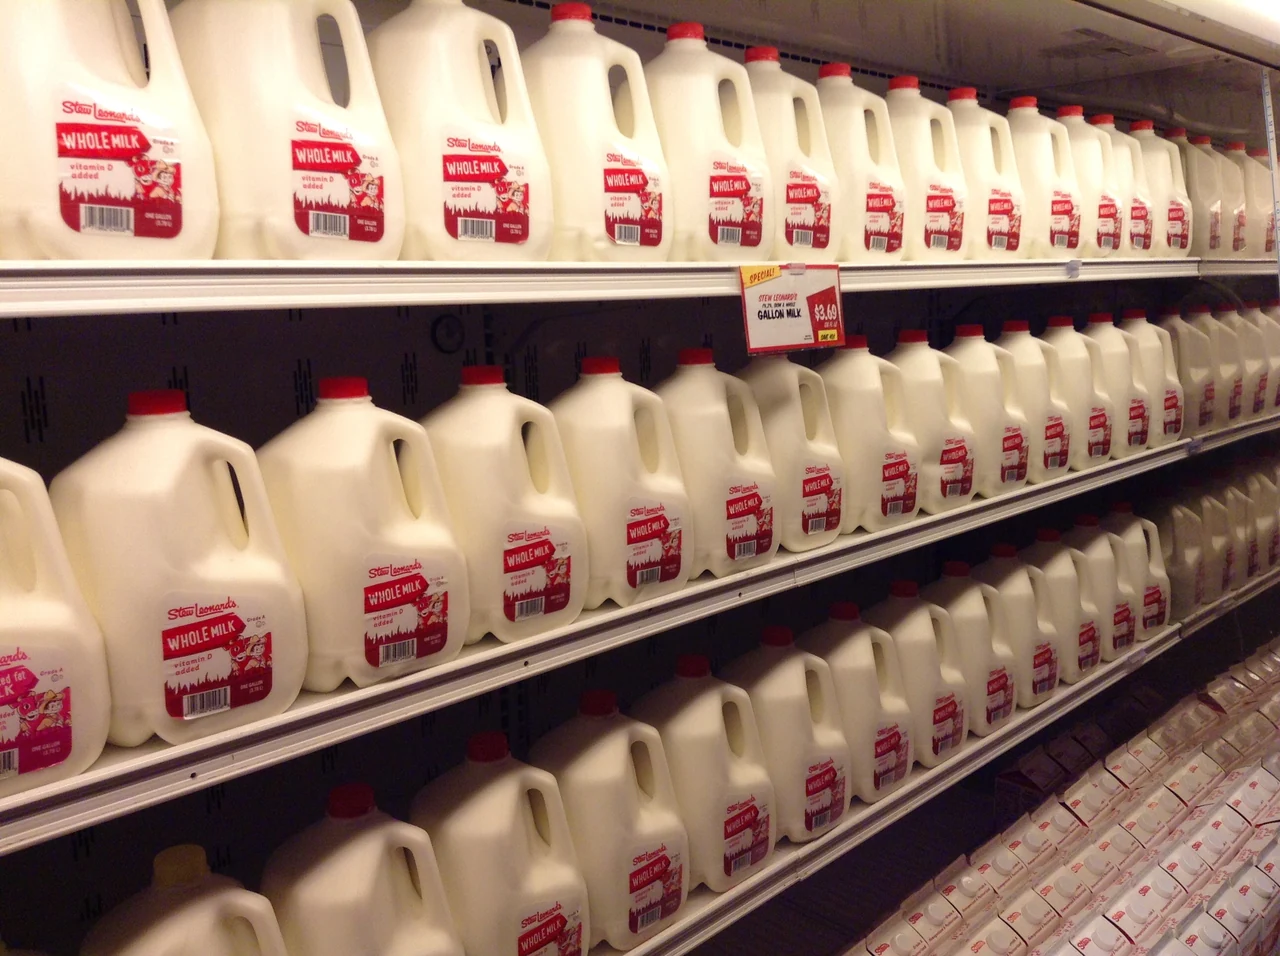
April 28, 2015: $3.69 per gallon at United States. Gallon milk; grade not stated. Browse historical milk price photos and compare U.S. averages.
Stew Leonard’s GALLON MILK $3.69 sign beside gallon milk jugs. Photograph source · CC BY 2.0
What did milk cost? Browse dated price photos, or choose U.S. average to explore the monthly retail price.
Each photo shows its posted package price and quantity. The average and chart use per gallon. Fresh milk in a known quart or half-gallon package is plotted as a clearly labeled gallon equivalent; the photo price stays unchanged. Canned milk or unknown quantities stay in the photo collection without a comparable chart point. The average covers fresh, fortified whole milk, including organic and non-organic milk. Reduced-fat, plant-based and other milk types are not the same comparison. The first two numbers show the photographed price and the U.S. average from that time. The third converts one of those prices into current dollars; tap it to switch between the photo and the average. The chart has its own dollar switch. A converted price is not today’s selling price.
Inflation comparisons use the U.S. CPI-U, all items, not seasonally adjusted. A month uses that month’s index; a year-only photo uses the year’s average. The month in “In Current” is the latest published CPI month and updates as new data arrives. CPI compares general purchasing power, not wages or driving costs.
The Bureau of Labor Statistics publishes monthly average retail prices for U.S. cities, not a price for every store or day. Missing months stay missing. A year-only photograph uses the mean of all twelve published monthly prices, only when every month is available; this is a calculated mean, not a separately published annual price.
A monthly average can match a photo from the same month only when its product, per gallon unit and date are verified. Whole milk · per U.S. gallon is the comparison; other variants must be explicitly approved before automatic matching. Specialty or uncertain products remain browseable but are excluded from automatic matching.
The photo keeps its own date and price. Stores and stations can charge more or less than the national average.
The small i on each photo shows who took it, where it came from and its license. Some photos allow noncommercial use only; those are marked there.
Some dates and places are approximate. “c.” means “circa,” or “around.” A map pin may show a town or a wider area. Check the photo’s i for how much we know.
BLS average-price estimates show the price level for the item mix sampled in each month. That mix can change over time, so this line is not a fixed-basket measure of inflation; an item’s CPI index is more appropriate for measuring price change. The current-dollar conversion uses all-items CPI. All prices are in U.S. dollars and are not seasonally adjusted. The average covers fresh, fortified whole milk, including organic and non-organic milk. Reduced-fat, plant-based and other milk types are not the same comparison.
When only a month or year is known, we place the photo halfway through it. A decade-only photo sits in the middle of the decade and shows the mean of its annual averages. It isn’t used for price matching.
The map uses public-domain Natural Earth data.
35 photographs. Average data downloaded 2026-09-27.
Gasoline · Milk · Eggs
1893 · 1938 · 2006 · 2007 · 2008 · 2009 · 2010 · 2011 · 2012 · 2014 · 2015 · 2018 · 2020 · 2025 · 2026
Download photo records · Download average data
Stew Leonard’s GALLON MILK $3.69 sign beside gallon milk jugs. Distinct photographed local price; product variant is not automatically comparable with the standard U.S. average.